Within the world of technology and the internet, infographics have been created and shared at an amazingly fast rate. Anyone who is a visual learner will probably enjoy the world of infographics, as I do, and probably be involved in sharing them through social media. I personally share infographics that I like, and generally share them on Twitter.
Here is this week’s essential question:
- Have (and if so, how have) teaching and learning changed with the introduction of new tools?
and formative assessment questions:
- Are you starting to notice different things in your classroom?
- How are you changing what you do, or modifying what you do in the classroom?
When I think about all of these questions, especially applied to my own teaching, I have to say that new learning tools have opened up the walls of my classroom to the world. They have helped to broaden the perspective of my students and also given them a voice outside of the classroom. Bringing it back to infographics, I don’t know about you, but when I find a good one, I often like to use it as a reflective tool to see how I think I’m fairing and as a way to challenge myself.
Here’s one that I think most of you will be familiar with. It is one of the many infographics created for SAMR. I wasn’t introduced to SAMR till this past November, but since then I have kept it as a reflective tool to analyze how I am using technology and what objectives I have when integrating it into my classroom. I particularly like this infographic because I LOVE COFFEE! 🙂

Created by Jonathan Brubacker
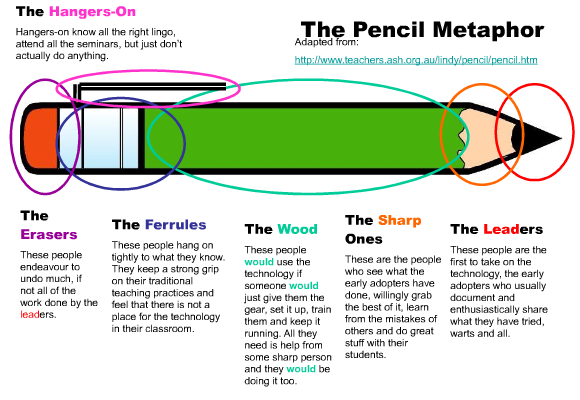
This next one I saw and retweeted just this morning! Where do you fall on this pencil scale?

Original graphic adapted from Lindy McKeown. Click to read a full post entitled “The Sharp End” by Steve Wheeler
I would like to think that I, along with many if not all of us COETAILers here, are “The Sharp Ones” or “The Leaders, because we are here, learning about educational technology from the course itself and from each other. I know that I was happy to see familiar names on the initial cohort list from my Twitter PLN and now I’m even happier to have been given the opportunity add to my PLN through those in this cohort that I haven’t “met” before. This particular infographic was more motivational for me than a way to reflect, looking at it helps me to feel comforted that it seems like I’m headed in the right direction! There is a blog post I found attached to this image which actually discusses the resistance to technology in schools. It’s seemed pretty perfect to link especially when looking at our readings for the week! Click on the image to read more about this post on “The Sharp End” by Steve Wheeler.
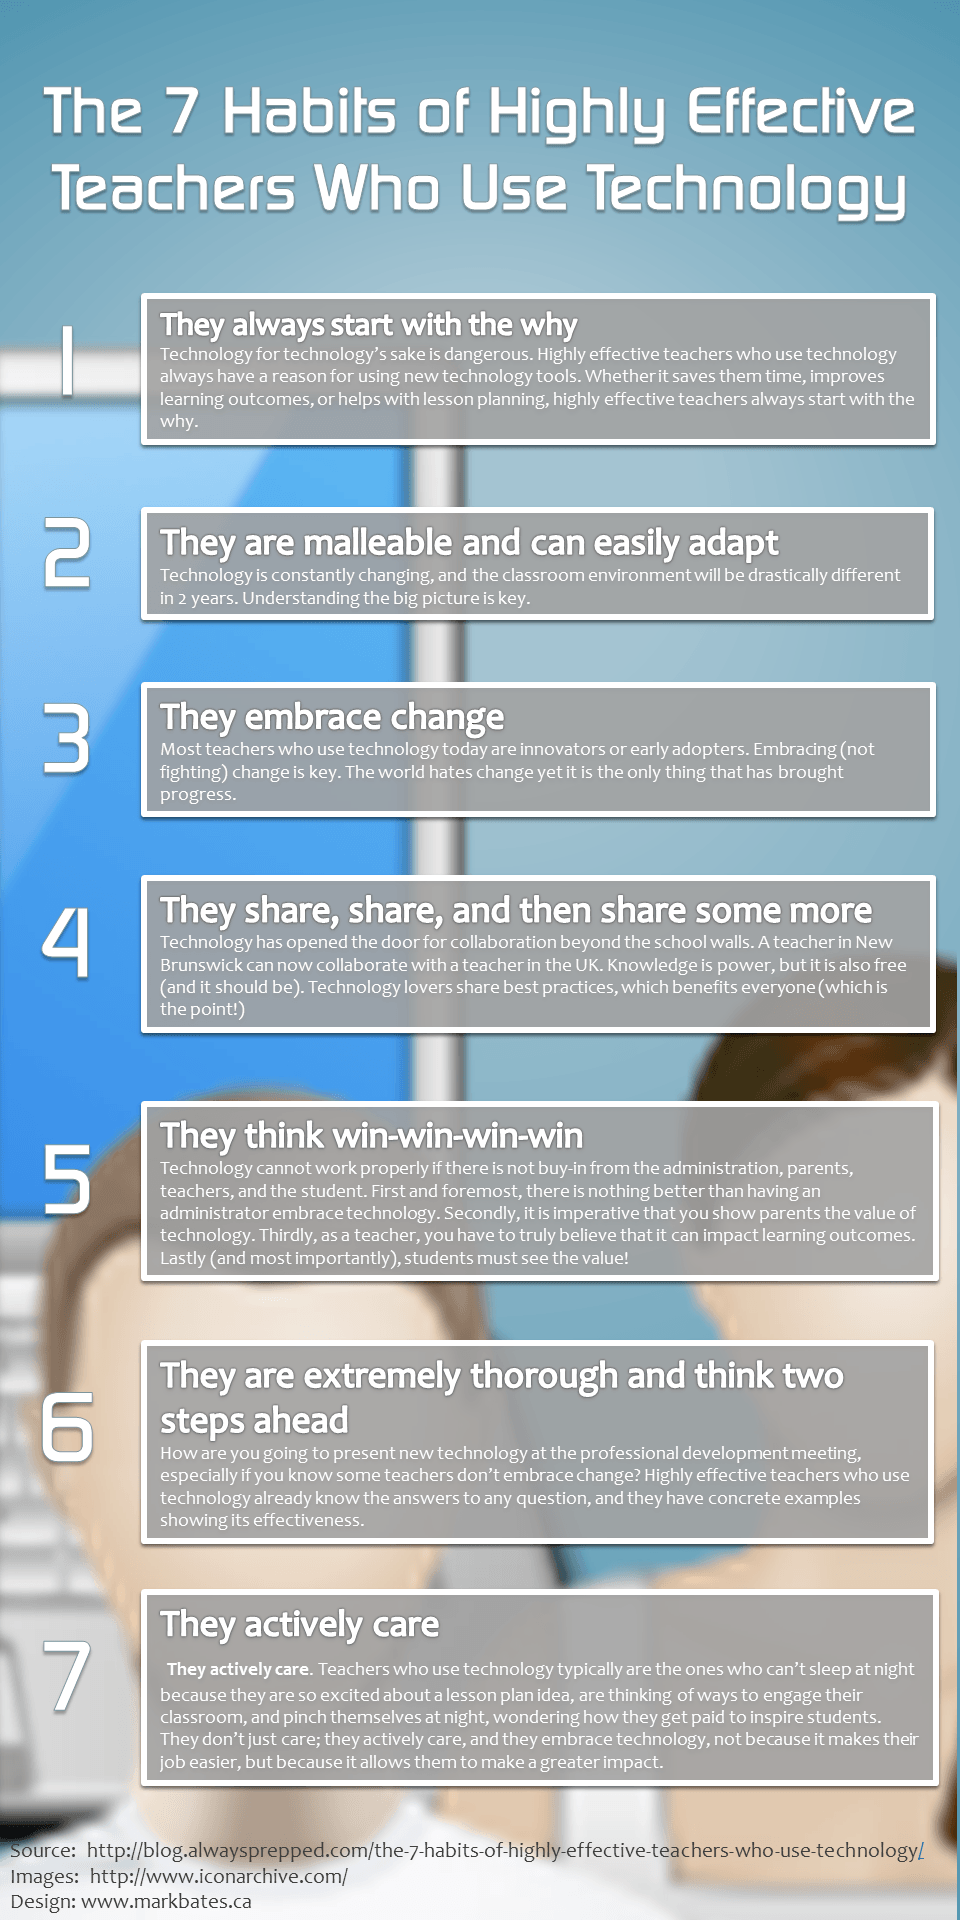
Finally, here is my last infographic that again, I found just this morning (goes to show that there are so many of them out there and they spread like wild fire!). It is about the “7 Habits of Highly Effective Teachers Who Use Technology”:

Find more education infographics on e-Learning Infographics
I really like this one because it’s like a little checklist for me, something I can go back to and remind myself of what is important and what things are better to let go of. A lot of these items are easier said than done, I don’t believe that we can always be on point all the time, and thus, reflection remains a huge part of teaching. Reflect, review, adapt, move forward.
Our readings as well as reading blog posts of others in this cohort have helped me become more reflective when planning for tech integration. I ask myself, “Could the same thing be done without technology” or “How is technology enhancing the students’ learning?” more often now. It has also inspired a few projects that I’ve taken on with my class! One of them will most likely be my final UbD project for course 1. I’m quite excited about trying these out with my studets and seeing where it goes! Overall, I’ve felt more challenged, especially to make tech integration useful and meaningful. I’ve also just felt more reflective.
These infographics are just some of the many great visual representations that have helped me to remain within that reflective process. Do you have any infographics that you particularly like and aid your reflective process? I’d love to see some other interesting ones!
I’d just like to end this post on a side note connected to my first post, “What?! Facebook is 10?!”. In that post I talk about how I’m afraid that future generations will forget how to socialize or interact without the use of some sort of device. Well, here’s a comical solution that has been thought up by Coke: The Media Guard! Happy weekend everyone!

Recent Comments